Today I realized that the VPS I’m renting for $20/mo is not as good as it seemed at first. Ever thought about high loads? Okay, this may sound like some DDoS hacking tools, but no! 100 requests with 10 simultaneous made my virtual private server think for ~ 1,5 minutes. Jeez!
It took me quite some time to find good software for running some load tests on my webserver, linux has some good utilities (linux.com/feature/143896), but I suggest you start from ApacheBench which is a command line utility bundled with the Apache distribution. It’s cross-platform, therefore you can use it on Windows (I did). Anyways, here’s how you launch a test:
ab -n 100 -c 10 http://www.microsoft.com/
Why did I pick Microsoft? Well, if I get like 10,000 views tomorrow and everybody tries that command, that’d be a DDoS attack on Microsoft servers and I think they’re good enough to handle it. My server would just explode :)
Anyways, take a look at what the results may be like:
Benchmarking www.kovshenin.com (be patient).....done

Server Software:        Apache/2.2.8
Server Hostname:        www.kovshenin.com
Server Port:            80

Document Path:          /
Document Length:        84 bytes

Concurrency Level:      10
Time taken for tests:   90.984 seconds
Complete requests:      100
Failed requests:        1
   (Connect: 0, Receive: 0, Length: 1, Exceptions: 0)
Write errors:           0
Non-2xx responses:      100
Total transferred:      36564 bytes
HTML transferred:       8674 bytes
Requests per second:    1.10 [#/sec] (mean)
Time per request:       9098.438 [ms] (mean)
Time per request:       909.844 [ms] (mean, across all concurrent requests)
Transfer rate:          0.39 [Kbytes/sec] received

Connection Times (ms)
              min  mean[+/-sd] median   max
Connect:        0   15   3.4     16      16
Processing:  2203 8866 8879.2   6188   48797
Waiting:     1969 8532 8664.9   5891   48750
Total:       2219 8880 8879.6   6203   48813

Percentage of the requests served within a certain time (ms)
  50%   6203
  66%   7281
  75%   8141
  80%   8313
  90%  17078
  95%  32266
  98%  43813
  99%  48813
 100%  48813 (longest request)
Ah.. And a failed request there, how sad… You might also want to check out your load on the server while benchmarking. Use the ‘top’ command, it should produce similar output:
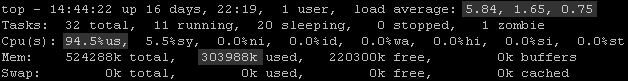
Yup, although the super cache plugin is working, wordpress consumes a lot of memory… I also ran this with a 500/100 requests, that made my server go down for like 6 minutes, I had over 200 failed requests and my blog kept saying database connection error until the test had finished. Free memory dropped down to 0! Scary? For more information about how ab works, read Apache HTTP server benchmarking tool documentation at apache.org.