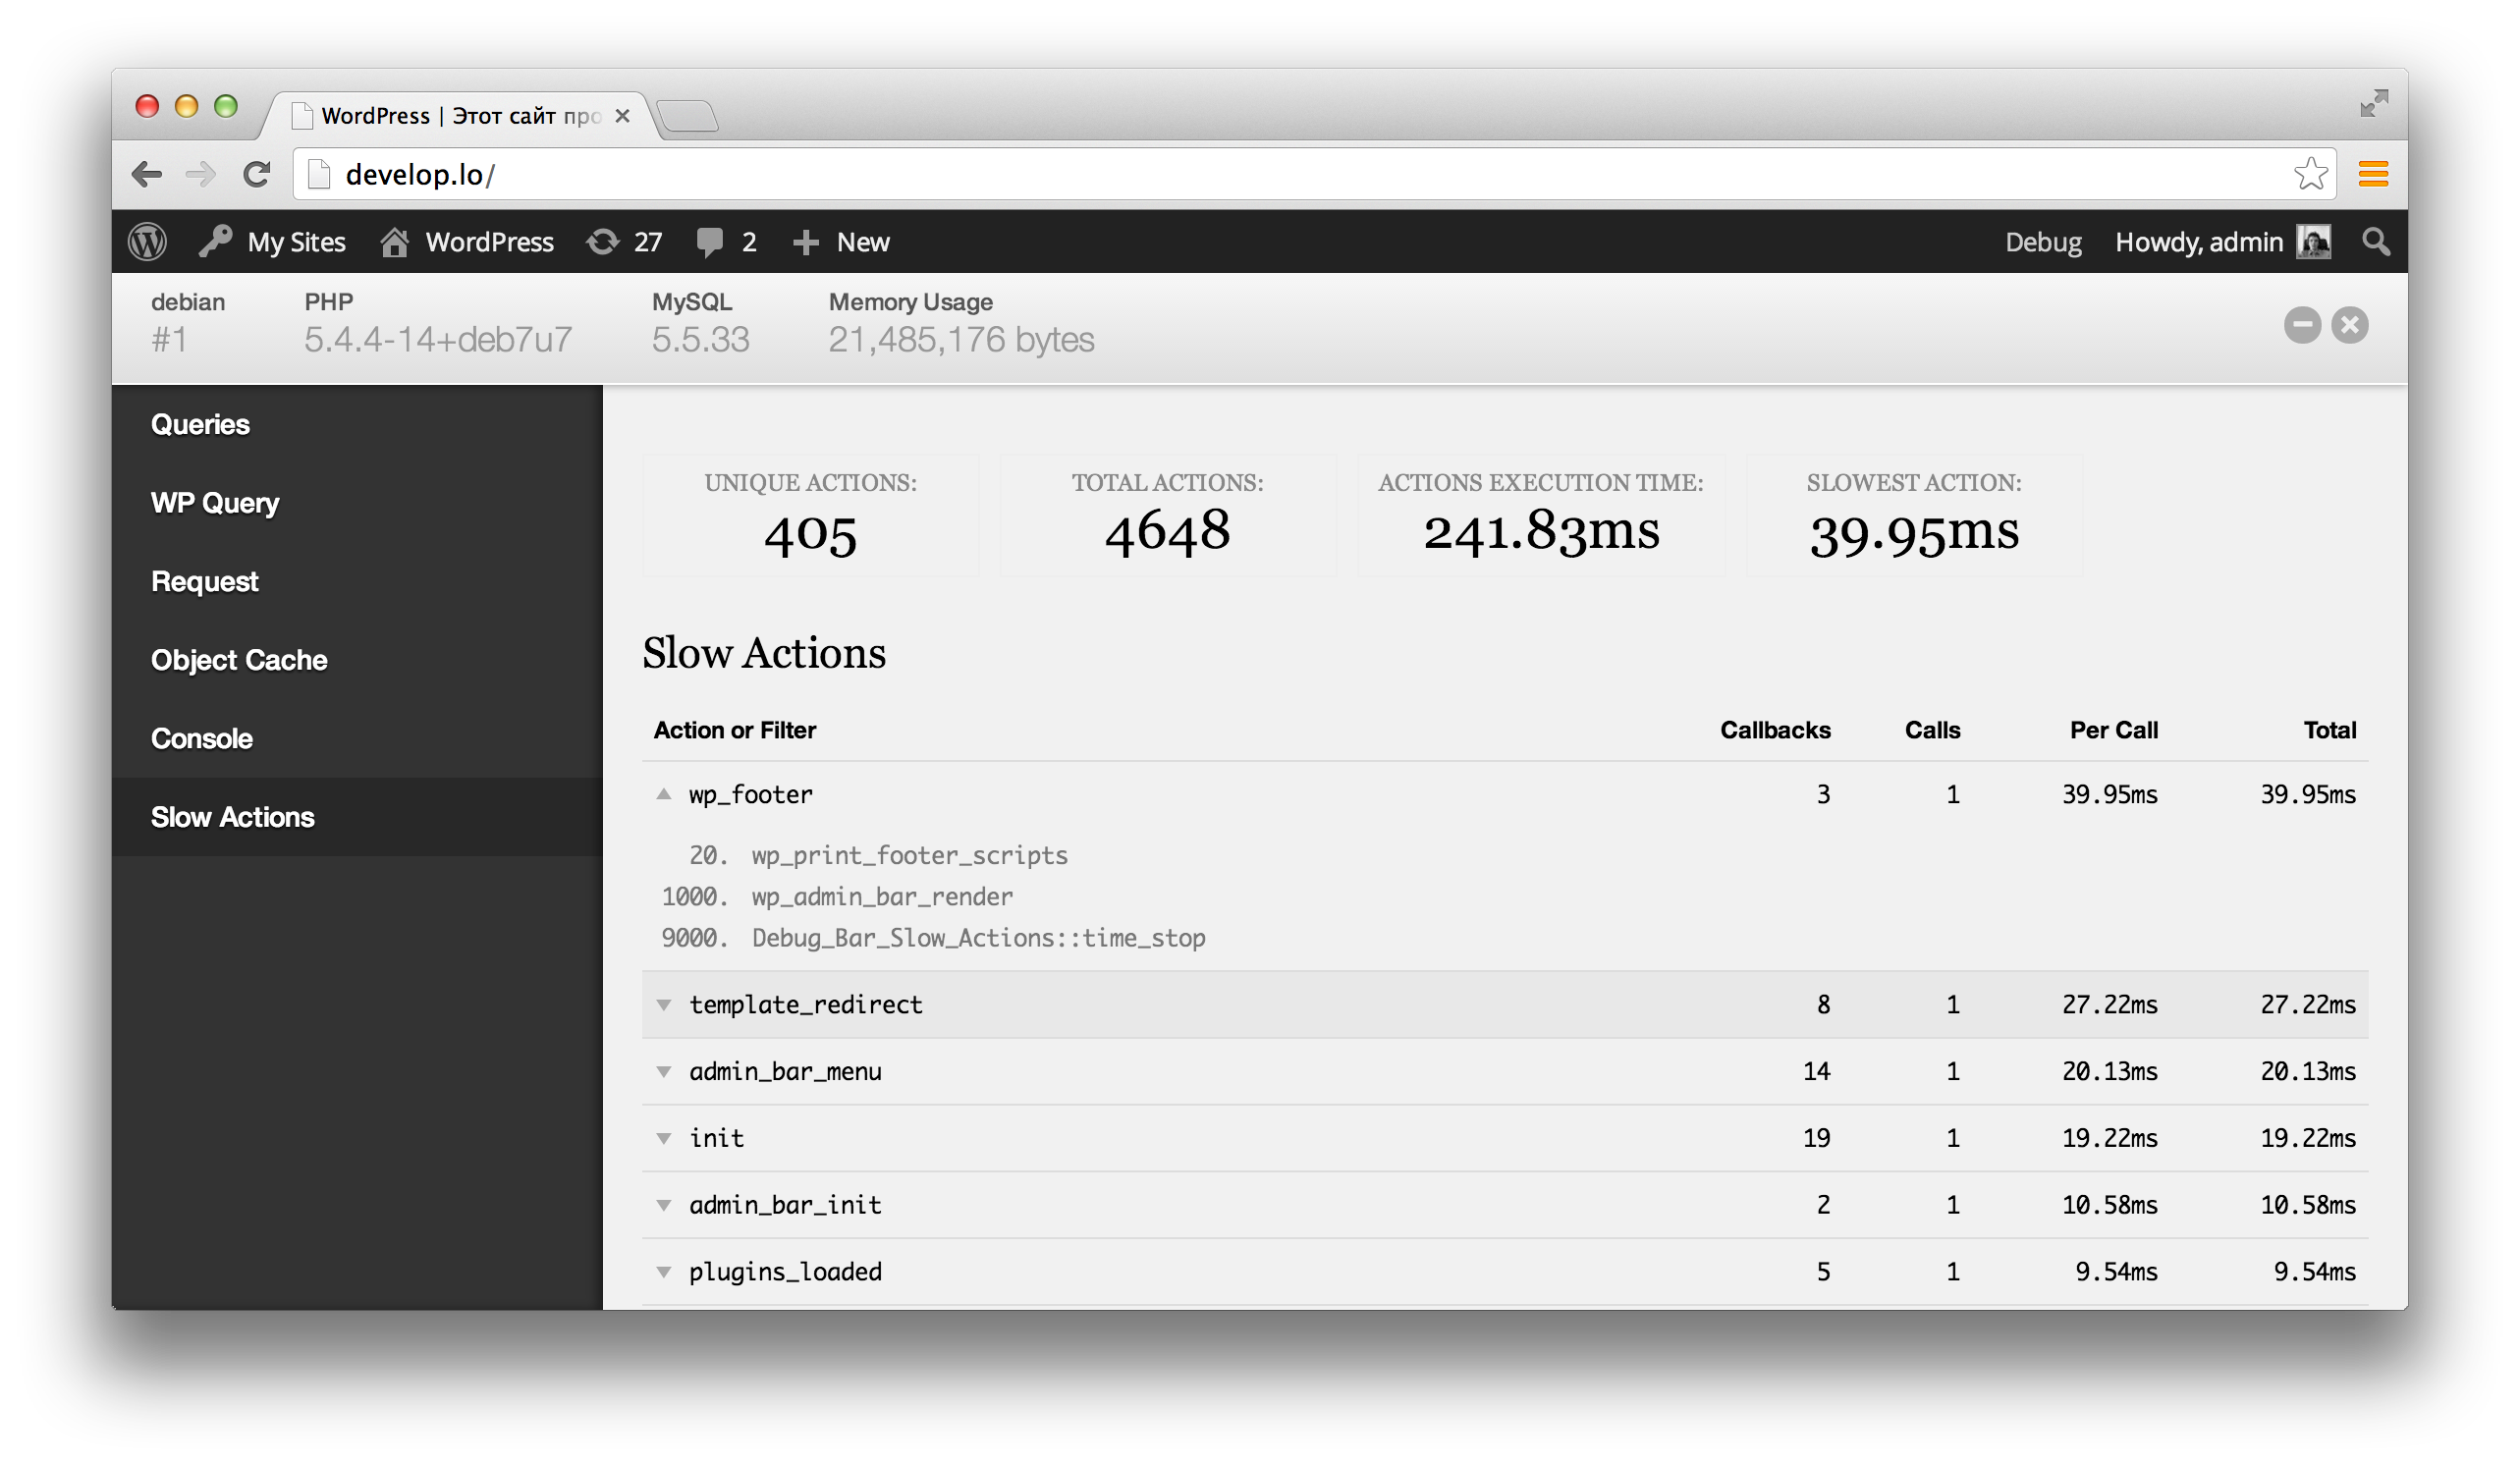
If a typical WordPress page load takes more than one second, chances are there’s something terribly wrong with your site, a theme or a plugin is probably doing something it shouldn’t. Obviously you don’t have time to review every single line in your codebase, so Debug Bar Slow Actions might help you out.
Debug Bar Slow Actions is an extension for the popular Debug Bar plugin. It adds a new panel with a list of the top 100 slowest actions (and filters) during the current page request.

It’s fairly lightweight (as opposed to xdebug and other profiling tools), but I wouldn’t recommend running it on a production environment, or at least not for long. It does hook to each and every action and filter (twice!) to time it, though timing is pretty fast and it’s highly unlikely that it’ll ever become a performance bottleneck.
After you’ve found out which action is the slowest, you can easily lookup the callback functions hooked to that action, perhaps using tools like Query Monitor, or a simple var_dump:
add_action( 'init', 'whats_at_init', 9999 );
function whats_at_init() {
	var_dump( $GLOBALS['wp_filter']['init'] );
}
Update: version 0.8.1 and above will show you the number of callbacks hooked to each action, and it’s also possible to expand the callbacks list.
You can get Debug Bar Slow Actions from WordPress.org or GitHub.
Happy profiling!
Sounds like a great tool, Konstantin!
As it is depending on the Debug Bar plugin to be present, you might want to include the TGM Plugin Activation class, which makes it easy for people to install the Debug Bar without having to go look for it.
I have integrated it recently in two of my Meta Box plugin extensions and it works awesome. It’s by Thomas Griffin and available at Github: https://github.com/thomasgriffin/TGM-Plugin-Activation
Thanks Piet, I’ll check it out :)