A few months ago I set out to build a page caching plugin for WordPress from scratch and streamed it live. The result was a simple filesystem-based advanced-cache.php implementation. It was nowhere near perfect, but it worked.
It worked so well, that I decided to put some more effort into it, and I’m happy to report that it’s been running successfully on some production sites published with Sail over the past few weeks, and since quite a few Sail users have asked for a built-in caching implementation, this looks very close to what could be it.
In this post I’ll share some of the concepts behind this page caching implementation, some load testing I’ve done, and some integration plans going forward.
No configuration
The WordPress open source project has proven times and times again, the “decisions, not options” approach tends to work really well, especially in the long run. Even if it means that some advanced users have to jump through some hoops to get things working the way they want.
I’ve played around with a lot of page caching plugins for WordPress, ranging from ones with hundreds and hundreds of different options in a wp-admin UI, to ones with only a few. I want my implementation to have none. Of course it’s not going to be suitable for every possible use case, and likely not the fastest implementation out there either, but definitely one of the simplest.
With cache invalidation figured out for most WordPress scenarios, I think I might not have a button or command to clear or flush the cache at all. If I can get away with that, I’d say my configuration goal was achieved.
For cache storage I chose the filesystem.
Why the filesystem? Isn’t it slow?
Yes. It’s slow. But there’s more to it than that.
You see, when you have a bunch of memory you’re not really putting to good use, Linux will use it for page caching, also known as disk caching. I know, the naming is so confusing in this context. Essentially it’s blocks of data (called pages, hence the name) read from disk, cached into RAM. For the sake of simplicity, let’s call this thing “disk caching” going forward.
When your application attempts to access a file on disk, often times the system will just serve it from memory, without actually touching the disk. I ran a quick test to find out how true this is for my page caching plugin.
First, I generated a thousand of different cache keys by using rand() in the plugin’s key() function:
function key() {
    // ...

    return [
        // ...
        'cookies' => $cookies,
        'headers' => $headers,
        'c' => rand(1, 1000),
    ];
}
Every time I hit a page, I would randomly get 1 out of 1000 variations. I used the iotop tool to measure disk IO, and the hey benchmark utility to generate some traffic. I also made sure php-fpm is running a single child in pm.static mode, so that I could use lsof to see what files the process is accessing.
The funny thing, is that I had to add a sleep(1); between my call to fopen() and fwrite() to even be able to see the cache filename in lsof, and this is on a write operation. Furthermore, I was able to confirm, with a tool called fincore, that my .data and .meta cache files were indeed in Linux’s disk cache:
/var/www/public/wp-content/cache/sail# fincore */.{meta,data}
RES PAGES SIZE FILE
4K 1 252B 04/a75e13caecab59468bee9e0fb7fe3704.meta
4K 1 252B 5d/5dc8aa3457b0743ffbd649f5cbc8b25d.meta
12K 3 11.1K 04/a75e13caecab59468bee9e0fb7fe3704.data
12K 3 11.1K 5d/5dc8aa3457b0743ffbd649f5cbc8b25d.data
# ...
And when the cached file is not being accessed for a while, it’s removed from the disk cache by the kernel. It’s like a free LRU cache eviction policy. Well, kind of… It’s a bit trickier than that, but it gets the job done quite efficiently. If you’re looking for a great read on disk caching, I highly recommend this piece.
Is it as fast as Redis or Memcached?
Naturally you’ll want to compare this to other caching options, such as Redis and Memcached. Both are really great and efficient in-memory key-value stores.
And yes, reading files from the kernel’s disk cache is just as quick and efficient, as reading it from a memory-based key-value store. In fact, it is often times significantly faster (#, #). It’s also why Nginx’s proxy_cache and fastcgi_cache will beat Redis hands down in many tests.
I was skeptical, so I decided to run some of my own tests. I installed Memcached and Redis servers, added some data to each one, and put the same data on a file on disk. I ran a few tests using the Sail profiler, and indeed, filesystem access was significantly faster in all cases. I’ll share the results in another blog post, so don’t forget to subscribe!
In any case, it’s not really a fair comparison.
Redis and Memcached are both remote key-value stores, usually accessed over a network, but even when accessed locally, there’s a TCP or unix socket layer, the Redis/Memcached protocol, etc. Which means that when you read or write data on a Redis or Memcached server, there’s a lot more happening behind the scenes.
Having said that, a remote key-value store is the better option once you start scaling out, which also gives you much more control over how your data is stored, when it’s evicted, and so on.
You can’t have this level of control with the Linux page cache (or disk cache), so if a process suddenly needs more RAM, the kernel will just evict all of your precious cached items, poof! This also means that if your application is memory-bound, or if there’s just too little of it, then file-based caching might turn out to be significantly slower.
Let’s run some tests
For testing purposes I deployed two separate servers on DigitalOcean using Sail CLI, in the same region. Both had 1 Intel vCPU with 1GB of RAM and 2GB of swap space. I used Hey to run various stress tests from one server, targeting the other.
Note that I’m using HTTPS in all of these tests, which is terminated by Nginx, that sits directly in front of PHP-FPM. Running HTTP-only tests will give slightly better, but insecure results.
The first test was a plain vanilla WordPress installation, no page caching whatsoever.
$ apt install hey
$ hey -n 1000 https://ace61a698124a1f1.justsailed.io
Hey’s default test does 200 requests with a concurrency level of 50. I left the concurrency at 50, but ran 1000 requests to get a better baseline number.
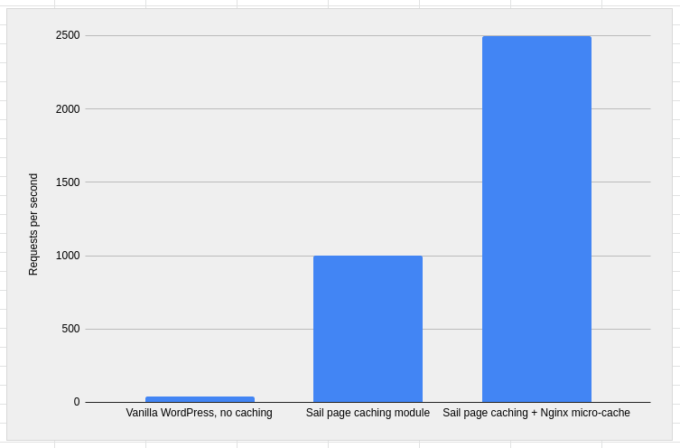
The first run gave only about 2 requests per second, likely because MySQL buffers were cold, PHP’s opcode cache was empty, etc., so after priming it a couple times, I got to an average of 35 requests per second.
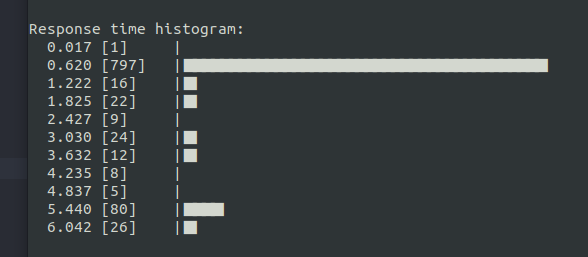
The average request time was about 800 ms, maxing out at 5-6 seconds, no errors. Watching vmstat during the test showed that the CPU was running at 100%, meaning the test was CPU-bound.
Next, I added the Sail page caching module, and ran the same test.
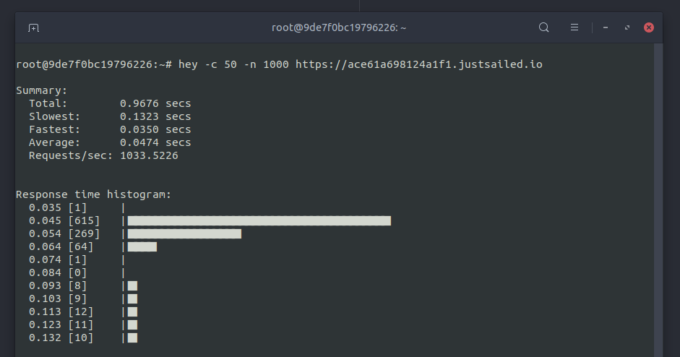
The results were significantly better, with an average of 1000 requests per second, and 45 ms response time, with the slowest requests clocking in at about 120 ms.
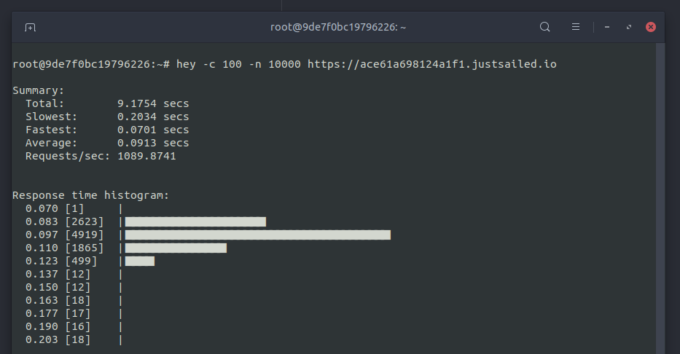
Since the test was so quick, I increased the total number of requests and started getting some errors at about 10,000 request with 50 concurrent:
2021/11/24 11:46:26 [alert] 21179#21179: socket() failed (24: Too many open files)This meant that Nginx was hitting the operating system’s number of open files limit, which on most systems defaults to 1024. Nginx itself allows you to increase the limit using the worker_rlimit_nofile configuration directive, which indeed ran the test with no errors.
The average was still at about 1000 requests per second, with 10,000 total requests at 100 concurrent.
Finally, I’ve added an Nginx so-called “microcache“. It’s based on the fastcgi_cache functionality in Nginx, which caches responses from FastCGI upstreams on … you guessed it, the filesystem! Very similar to how the Sail caching module works, but at the Nginx level, which means that if we get a cache hit, then we never even get to FastCGI and PHP. This is extremely efficient, at the cost of some disk space.
I had it set to only record cache hits from Sail cache, and also have a cache time of one second. This means we don’t have to worry about purging cache in Nginx at all, which is always nice. The results were quite impressive and in-line with what was “promised” on the Nginx blog:
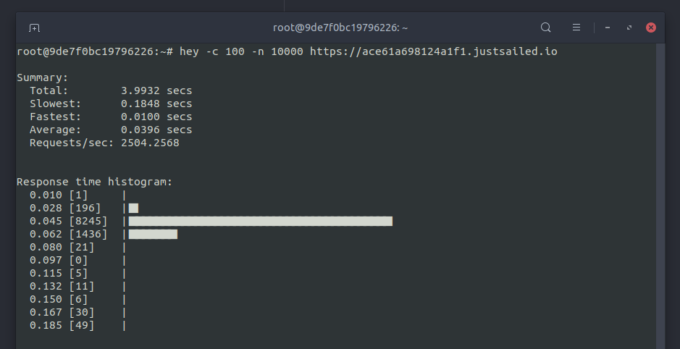
Over 2500 requests per second on average, with an average response time of about 40 milliseconds. I know you people like graphs, so here you go, more requests per second = better.
My vmstat wasn’t as idle as the results on the Nginx blog though, so I don’t think the tests were network-bound. Besides, I was able to get close to 1000 Mbps on the public network with these CPU-bound tests, while DigitalOcean’s recommendation is to push no more than 300 Mbps anyway :)
Going forward
Personally, I’m happy with these results, and with a few more minor tweaks, I’ll add this configuration and the caching module to Sail, maybe as a default. The plugin currently lives in a GitHub repository called sail-modules, so feel free to dig around the source code.
I will also try and make it available outside of Sail CLI, as a standalone plugin/dropin, though with most hosting providers having their own caching strategies these days, it’ll probably just get in the way, so not a huge priority at this point.
You can learn more about Sail CLI on the official website, and if you have any questions or feedback, please don’t hesitate to drop a comment or tweet. Also don’t forget to share the post if you enjoyed it!
Thanks very much for the effort Konstantin, can we use it as a plug-in in our websites, will it be in repository anytime soon?
Thank you.
Thanks for the kind words! It’s more of an experiment for now and something that will be integrated in Sail CLI. Having it available as a standalone version is not a priority, but might happen :)