Having to deal with performance problems on a WordPress site is never too pleasant, partly because the tooling is not great. Things like Query Monitor and the Debug Bar series of plugins can certainly help to some extent, but often times they’re not enough, because they do things in PHP, which is limited to, well… PHP.
Moreover, when reporting on database queries or remote HTTP requests, these tools will rely on the WordPress database and HTTP APIs, so if some theme or plugin happens to do a direct call to mysqli_query(), or file_get_contents(), etc., which is often the case with external third-party libraries, then you’re out of luck.
This is why you often need an actual profiler to get the job done.
The Sail Profiler for WordPress
TLDR? Watch the video:
Installing and configuring a PHP profiler and setting up the environment to analyze profiling data, can be a tedious task. With Sail CLI, however, all the profiling tools and modules are already built-in, installed and configured. All that’s left for you is to run the profiler on the URL you wish to analyze:
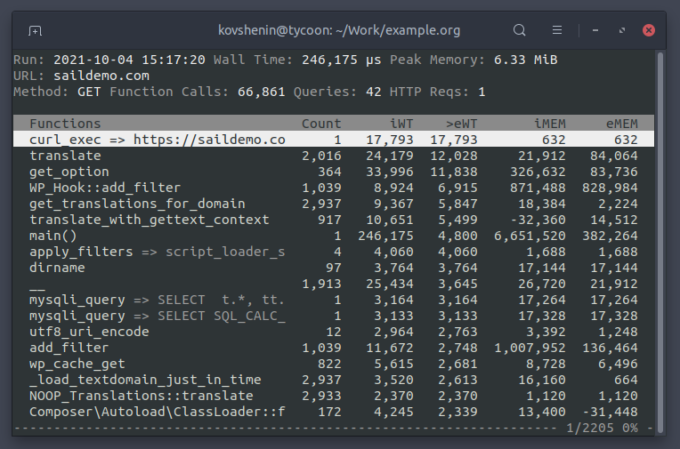
sail profile https://saildemo.comThis will perform a profiling request to the given URL, gather and save all the profiling data, download it, and display it in the Sail profile browser:

You can use the up/down keys to navigate through the list of functions. Left/right keys to change the sort column. Hit the enter key to step into a specific function to view its parent and child functions, and backspace to return one step back. Hit the q key to exit the profile browser.
If you find yourself stuck while digging further into the functions parent and child functions, you can always hit the escape key to return back to the main list of functions.
These downloaded profiles are saved to the .profiles directory of your Sail working copy, and can be opened at any time using:
sail profile .profiles/filename.jsonYou can also share this JSON file with a friend or coworker, and they can use the Sail CLI to analyze the profiling data without the need to even have the project on their computer.
Profiling WordPress Actions and Filters
Quite a while ago I wrote an extension for the popular Debug Bar plugin, called Debug Bar Slow Actions, which provided a list of slow WordPress actions and filters. Sail CLI can do that too, out of the box, and much better.
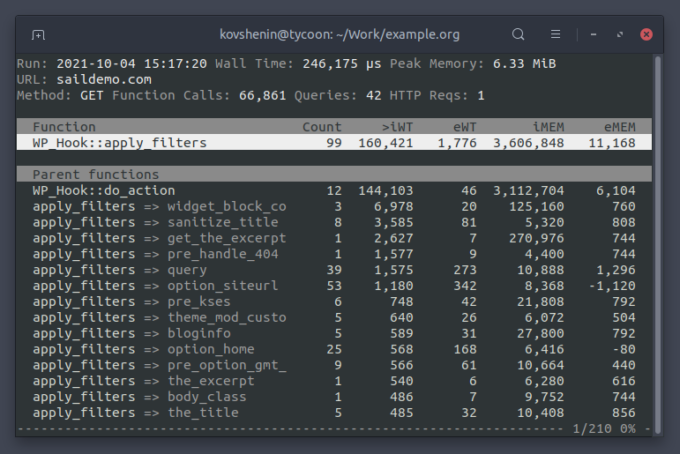
In the Sail profiler all calls to do_action() and apply_filters() are tagged with the action or filter name, so you’ll see them listed separately per action/filter in the list of functions. You can easily find these if you sort by inclusive wall time, and step into the WP_Hook::apply_filters method:

Similarly, the actions are behind the WP_Hook::do_action method call.
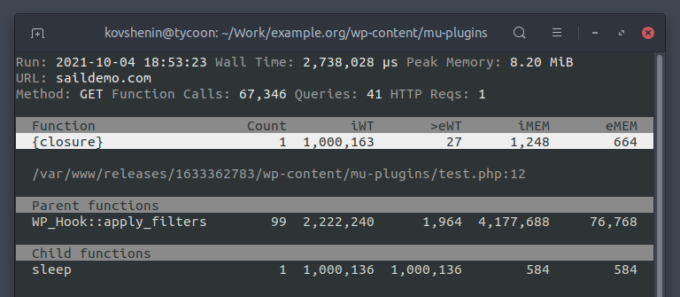
While not recommended, many developers use closure/anonymous functions when working with WordPress actions and filters, because it’s quick and very convenient. Unfortunately, it can create extra barriers when debugging or profiling your application. But not with Sail. All closure function calls are tagged with the filename and line number of the closure function.

Sail also tags all calls to mysqli_query() and related functions, as well as curl_exec(), to help track down slow database queries or remote HTTP calls respectively.
Complex Requests with a cURL Wrapper
Sail CLI ships with a special wrapper command for the curl system executable. This allows developers to transform any curl request, into a profiling request, just by prepending it with sail profile:
sail profile curl -H "X-Custom-Header: Value" \
    -X POST -d "foo=bar" https://saildemo.com
This is very convenient when working with browsers like Chrome or Chromium, which in their Network tab under the developer tools, allow you to select a specific request, and Copy as cURL. Which means you can easily profile requests for logged in users, wp-admin and AJAX requests, REST API requests, requests behind a paywall, and much more.
And if that’s not enough, you can use a browser extension, such as ModHeader for Chrome/Chromium to add a special X-Sail-Profile header to all your requests, which will trigger the Sail profiler.
Where to Get the Sail Profiler
The profiler is built into Sail CLI starting from version 0.9.15.
If you haven’t heard about Sail before, it’s a free and open source CLI toolkit, to provision, deploy and manage WordPress applications in the DigitalOcean cloud. You can install it using Homebrew, PyPI and various other methods for Windows, macOS and Linux.
Under the hood, the profiler itself is a fork of a fork of XHProf, the hierarchical PHP profiler from Facebook, with a few changes specifically for WordPress. The profile browser is built with Python Click and Curses (the programming library, not the swearing).
Visit the knowledge base to learn more about profiling WordPress with Sail.